Redis is a data structure server. It is open-source, networked, in-memory, and stores keys with optional durability. The name Redis means REmote DIctionary Server.
According to the monthly ranking by DB-Engines.com, Redis is the most popular key-value database.
It is increasingly common to see Redis being used in modern applications. In fact, the Cache-Aside Design Pattern that I discussed last week could be applied on Redis.
It stands to reason that with the increase in Redis usage in applications, the need for monitoring your Redis Clusters (and even standalone instances, for that matter) increases as well.
PRTG is a well known monitoring tool that is used by many professionals in the industry; in fact it's not the first time that I've talked about PRTG in this blog. Unfortunately, PRTG does not natively provide Redis sensors, but the advanced (and easy to use) API it offers allows anyone to write custom sensors; and that is exactly what I have done!
Introducing the Custom PRTG Redis Sensor
You can find the source code for this Custom Sensor on my GitHub cdemi/PRTG-Redis-Sensor. If you think you can contribute, go ahead and submit a pull request!
The compiled version of this sensor is located at github.com/cdemi/PRTG-Redis-Sensor/releases/.
I understand that some of you might not want to run a random exe from GitHub on their PRTG Servers/Probes, so you can just download or git clone the repository, investigate it and compile it yourself!
Installing the Custom PRTG Redis Sensor
Downloaded the latest PRTG.Redis.Sensor.exe from GitHub. The EXE takes one parameter which is the host and port for the Redis Server, for example: -t Stats -e 127.0.0.1:6379. For more advanced parameters, you can visit the README.
As with all PRTG Custom Sensors we have to move these files into the PRTG Custom Sensors Folder on the Probe that will be doing the Redis Query: %programfiles(x86)%\PRTG Network Monitor\Custom Sensors\EXEXML\[1].
Using the Custom PRTG Redis Sensor
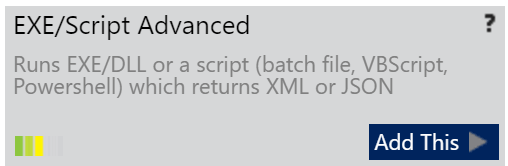
Since we have placed our Custom Sensor in the appropriate folder, it should just show up when we add a EXE\Script Advanced Sensor on our device:
In the Sensor Configuration Step 2, all you need to do is just write the sensor name, choose the Custom PRTG Redis Sensor we have just copied and fill out the Hostname/IP and Port of the Redis Server to monitor.
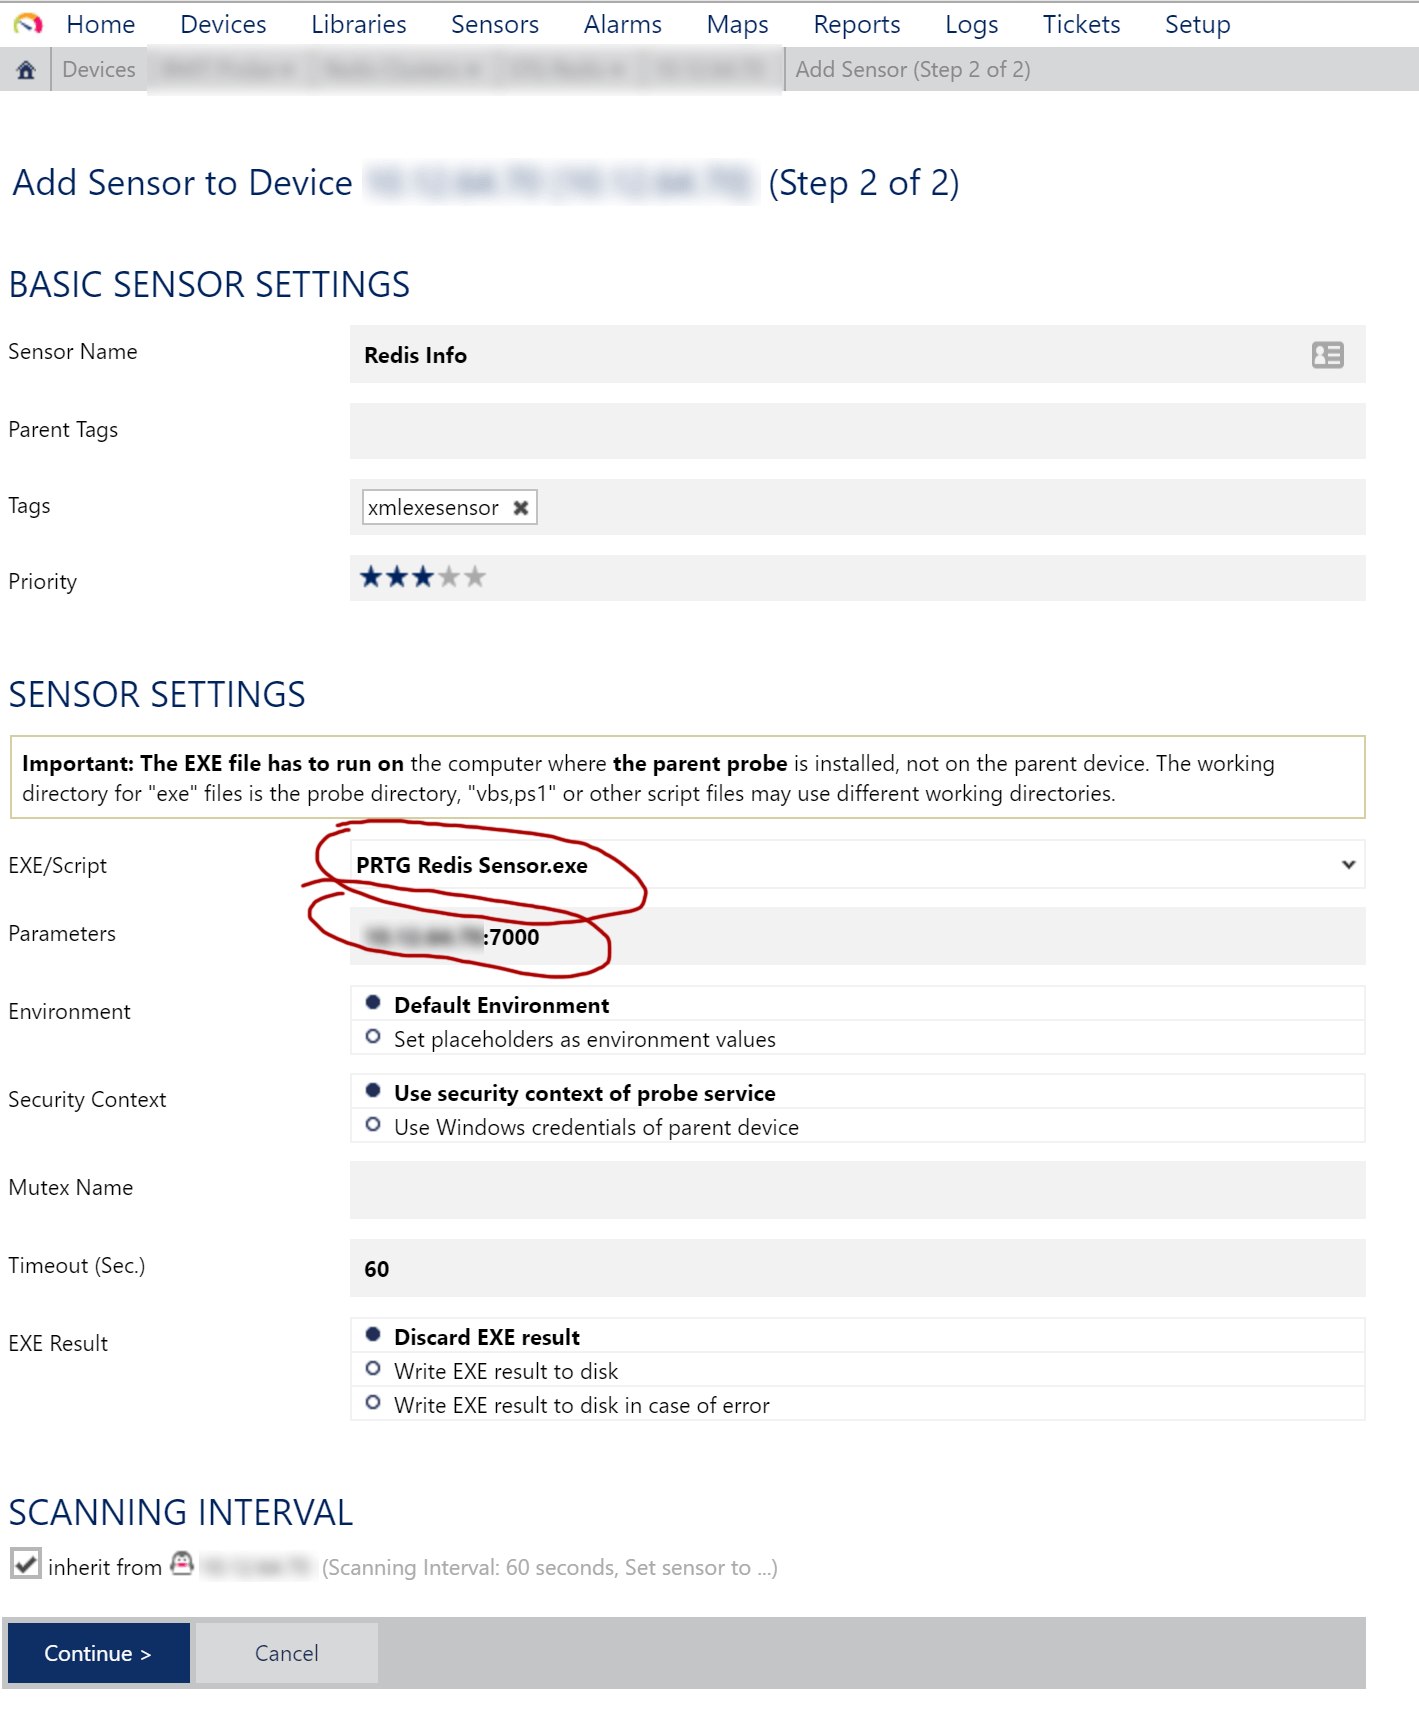
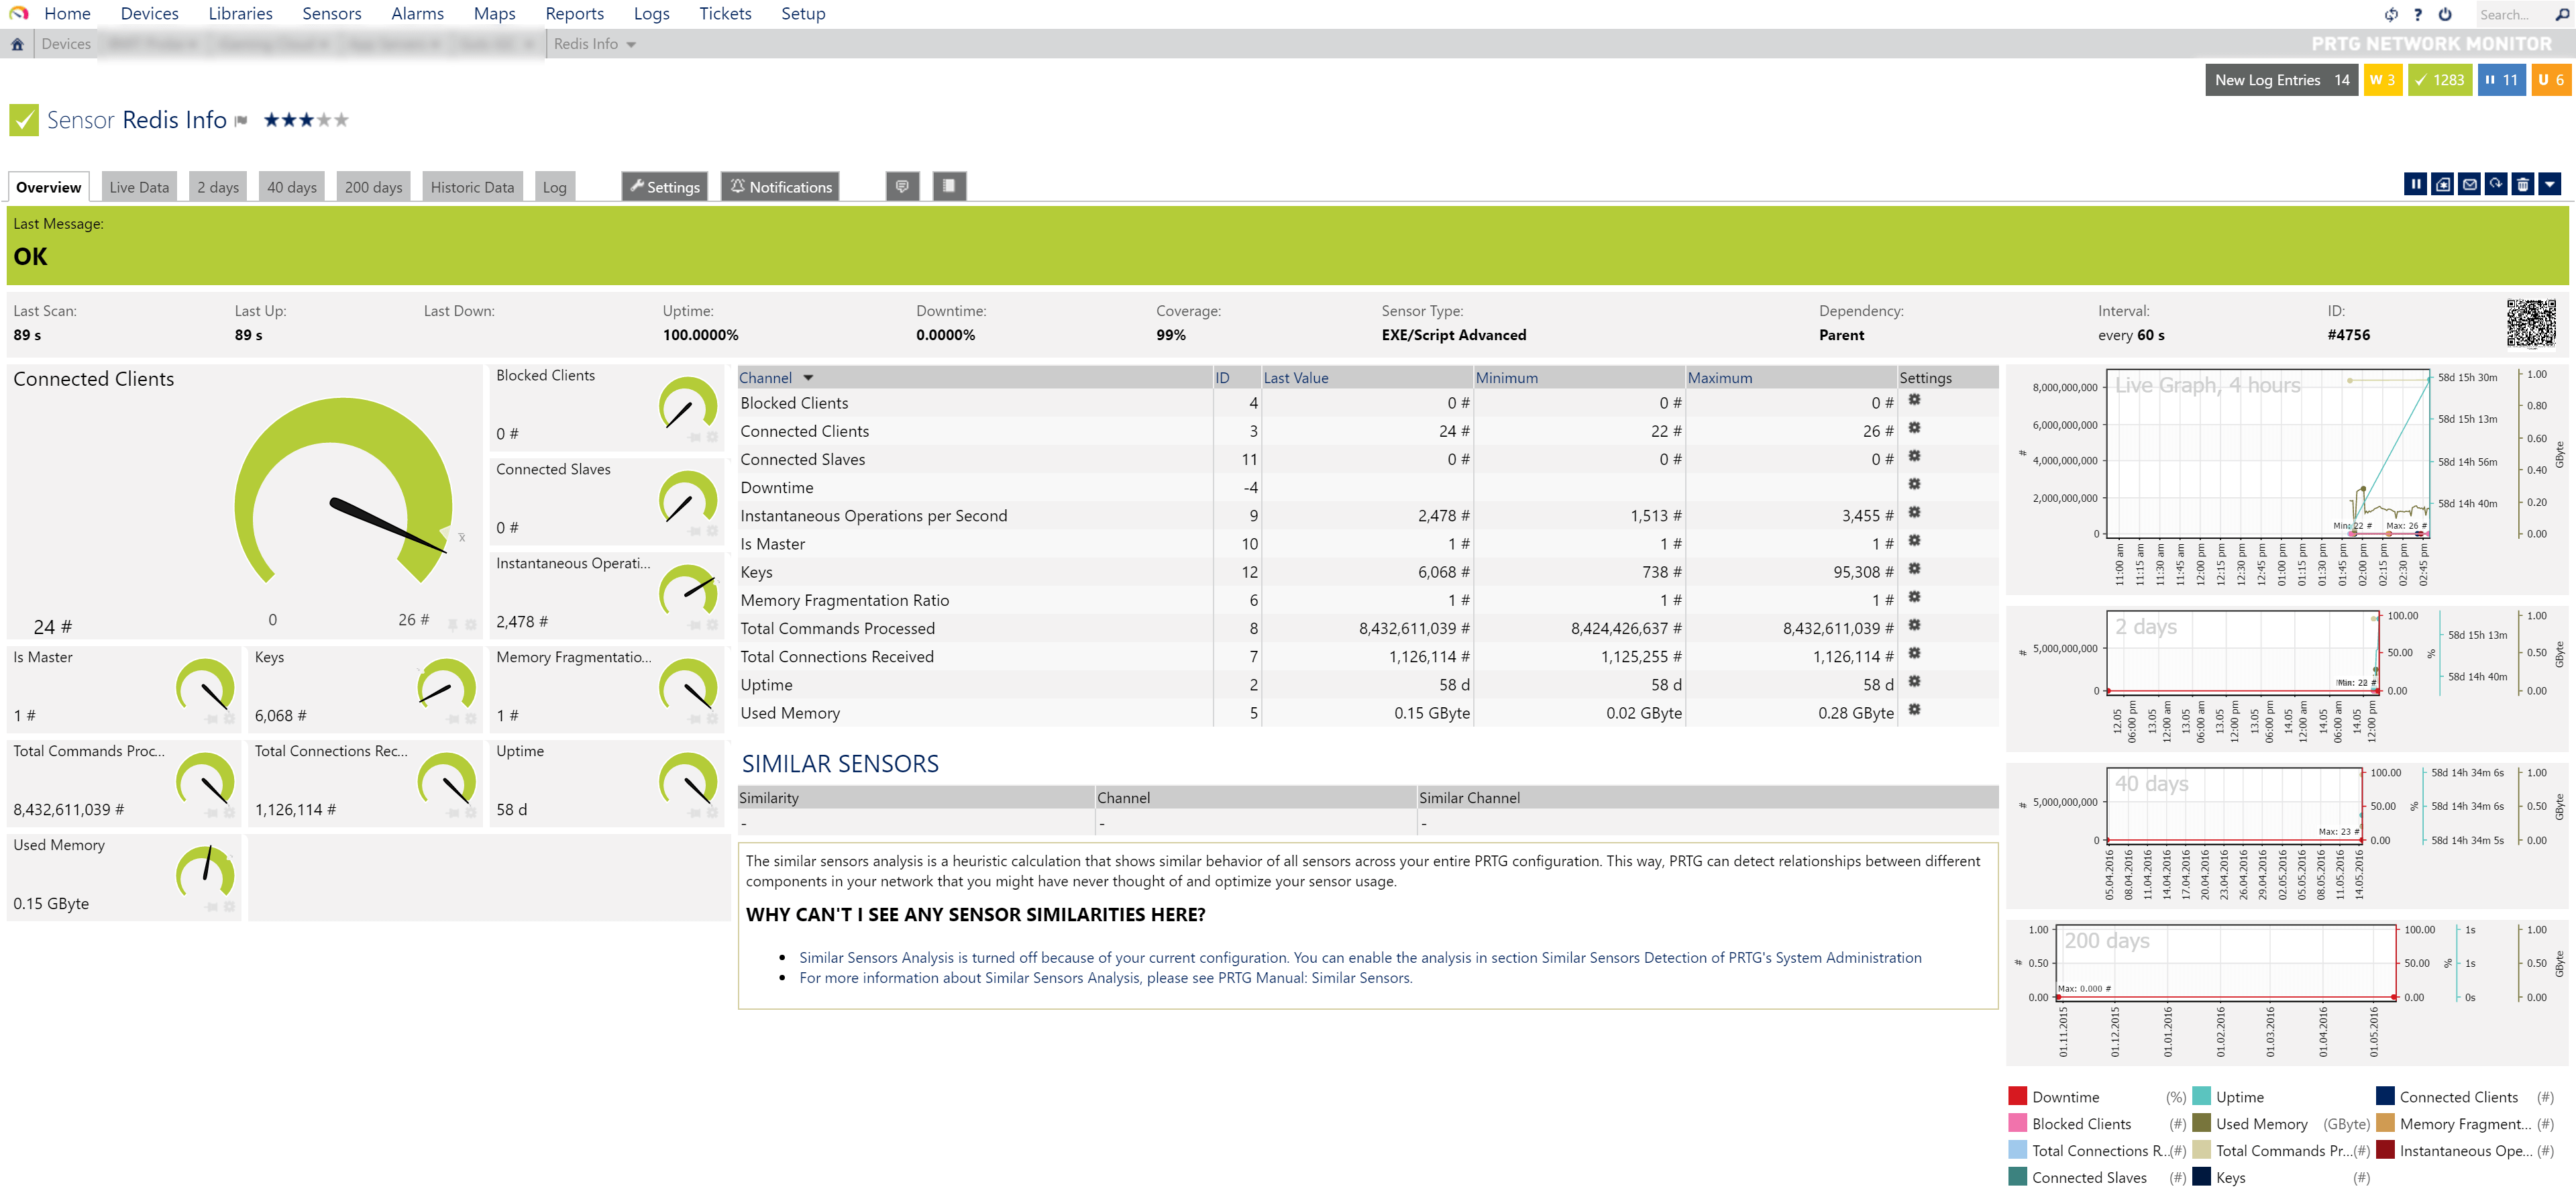
That is all! You now have a working Redis Sensor in PRTG :) As with all sensor channels in PRTG, you can customize Warning, Error Limits and other items as you like!
Contributing
This Sensor is Open Source under the MIT License so you can use, copy, modify, merge and publish as you like. If you have an interesting feature you'd like to add or request, don't hesitate to open an issue or fork and send a pull request!
These are the default paths. If you specified another installation directory, you will find your data there. ↩︎