If you have a production environment running RabbitMQ, it's important to gather metrics and have good alerting data. Fortunately for us, RabbitMQ's Management Interface has a REST API that we can query whilst PRTG has Sensors that can parse JSON. Then you can send your alerts over to Slack :)
Setting up RabbitMQ
Enable Management Plugin
The rabbitmq-management plugin provides an HTTP-based API for management and monitoring of your RabbitMQ server, along with a browser-based UI and a command line tool, rabbitmqadmin. The management plugin is included in the RabbitMQ distribution. To enable it, we need to run: rabbitmq-plugins enable rabbitmq_management on the RabbitMQ nodes. For more details on the Management plugin refer to RabbitMQ Documentation.
- The web UI is located at: http://server-name:15672/
- The HTTP API and its documentation are both located at: http://server-name:15672/api/
The management plugin is aware of clusters. You can enable it on one or more nodes in a cluster, and see information pertaining to the entire cluster no matter which node you connect to.
Creating PRTG User in RabbitMQ
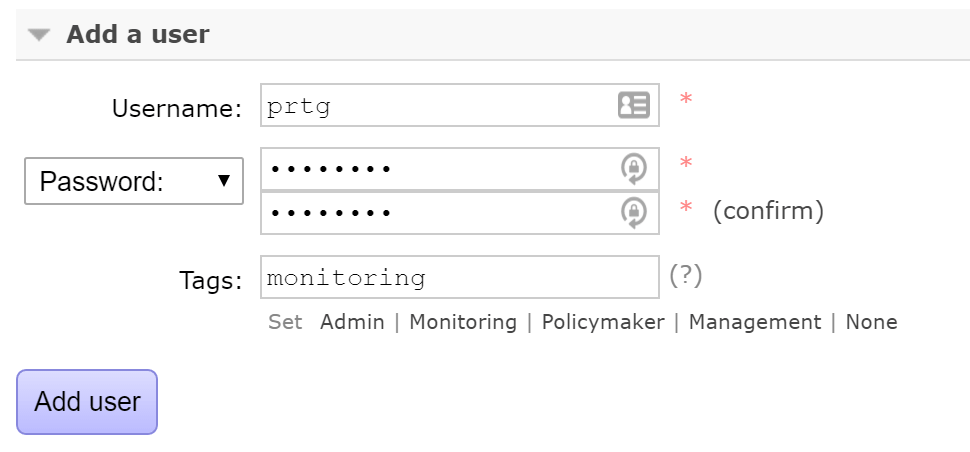
To use the HTTP API we will need to authenticate as a RabbitMQ user and we need to give the monitoring tag to this user.
Hopefully, now you should be able to visit http://server-name:15672/api/overview and get a valid JSON response with the PRTG credentials that we just created similar to this:
{
  "management_version": "3.6.0",
  "rabbitmq_version": "3.6.0",
  "cluster_name": "rabbit@RabbitMQ",
  "message_stats": {
    "publish": 529779,
    "publish_details": {
      "rate": 0
    },
    "ack": 1061483,
    "ack_details": {
      "rate": 0
    },
    "deliver_get": 1075057,
    "deliver_get_details": {
      "rate": 0
    },
    "confirm": 10,
    "confirm_details": {
      "rate": 0
    },
    "redeliver": 5307,
    "redeliver_details": {
      "rate": 0
    },
    "deliver": 1075056,
    "deliver_details": {
      "rate": 0
    },
    "get": 1,
    "get_details": {
      "rate": 0
    }
  },
  "queue_totals": {
    "messages": 9051,
    "messages_details": {
      "rate": 1.2
    },
    "messages_ready": 9051,
    "messages_ready_details": {
      "rate": 1.2
    },
    "messages_unacknowledged": 0,
    "messages_unacknowledged_details": {
      "rate": 0
    }
  },
  "object_totals": {
    "consumers": 10,
    "queues": 13,
    "exchanges": 53,
    "connections": 18,
    "channels": 18
  },
  "statistics_db_event_queue": 0,
  "node": "rabbit@RabbitMQ2",
  "statistics_db_node": "rabbit@RabbitMQ3"
}
This is all the configuration needed from the RabbitMQ side. As you can see, there is a good amount of data that can be used for generating specific sensors in PRTG depending on your needs.
Setting up PRTG
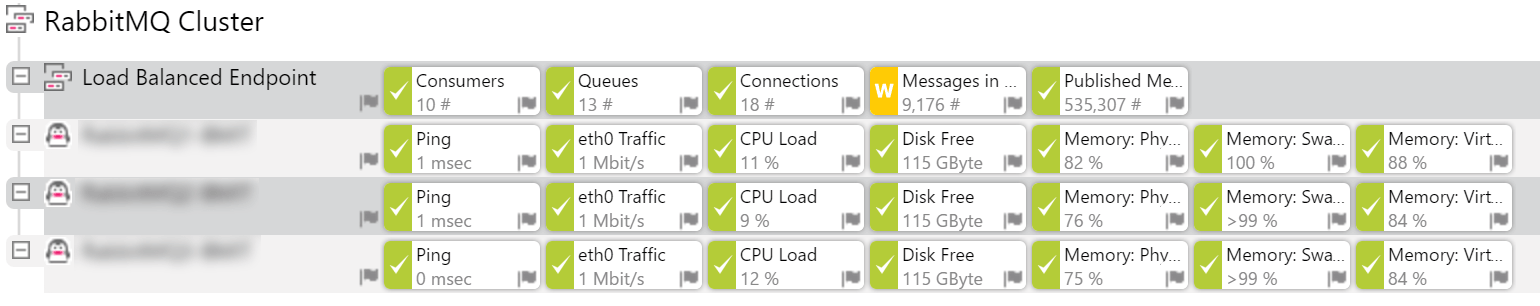
With the above API call it's just a matter of preference what sensors you monitor. For example, this is a sample setup:
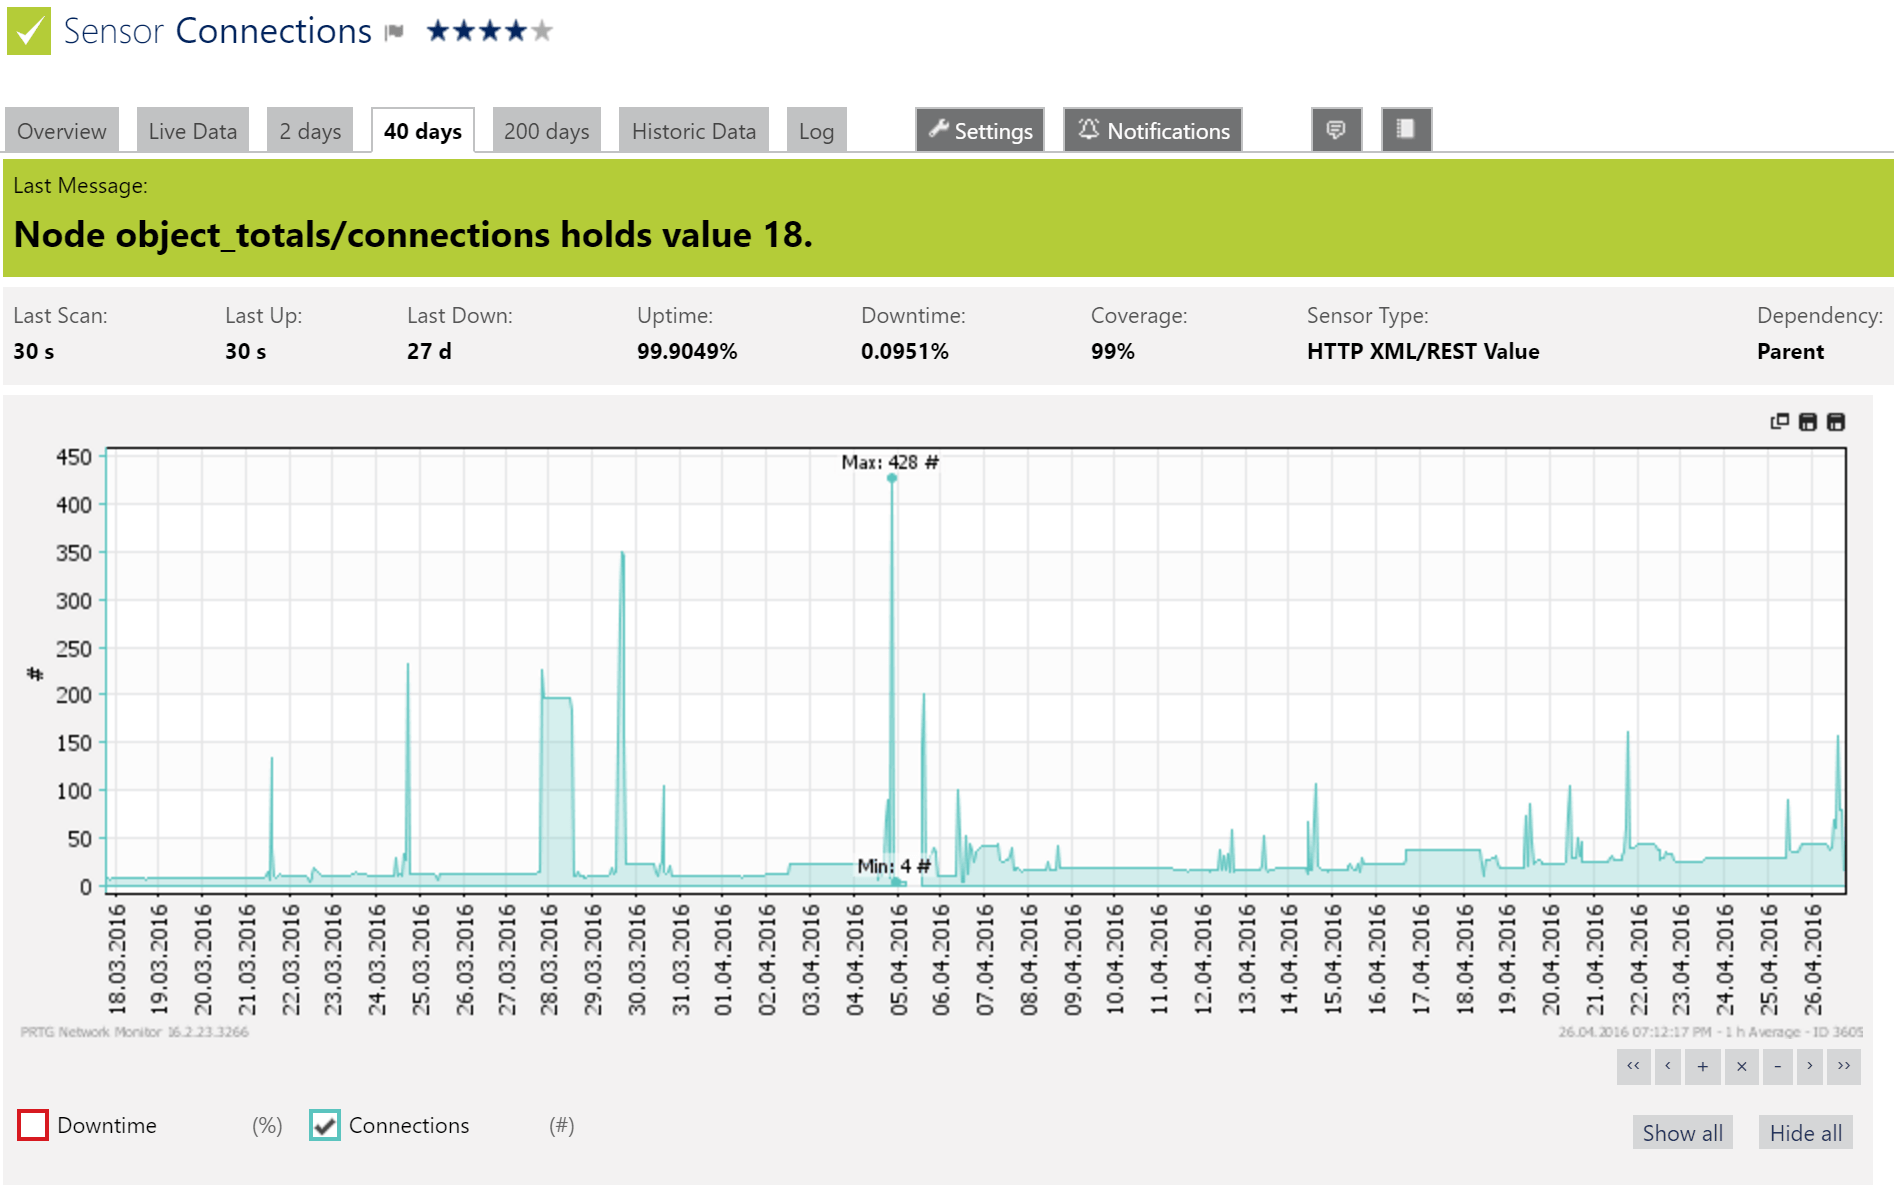
For example, in our case, PRTG helped us identify an issue with misbehaving clients that were opening an abnormal amount of connections to the RabbitMQ cluster.
Adding a Sensor
To add a sensor, all you need to do is to add an HTTP XML/REST Value Sensor.
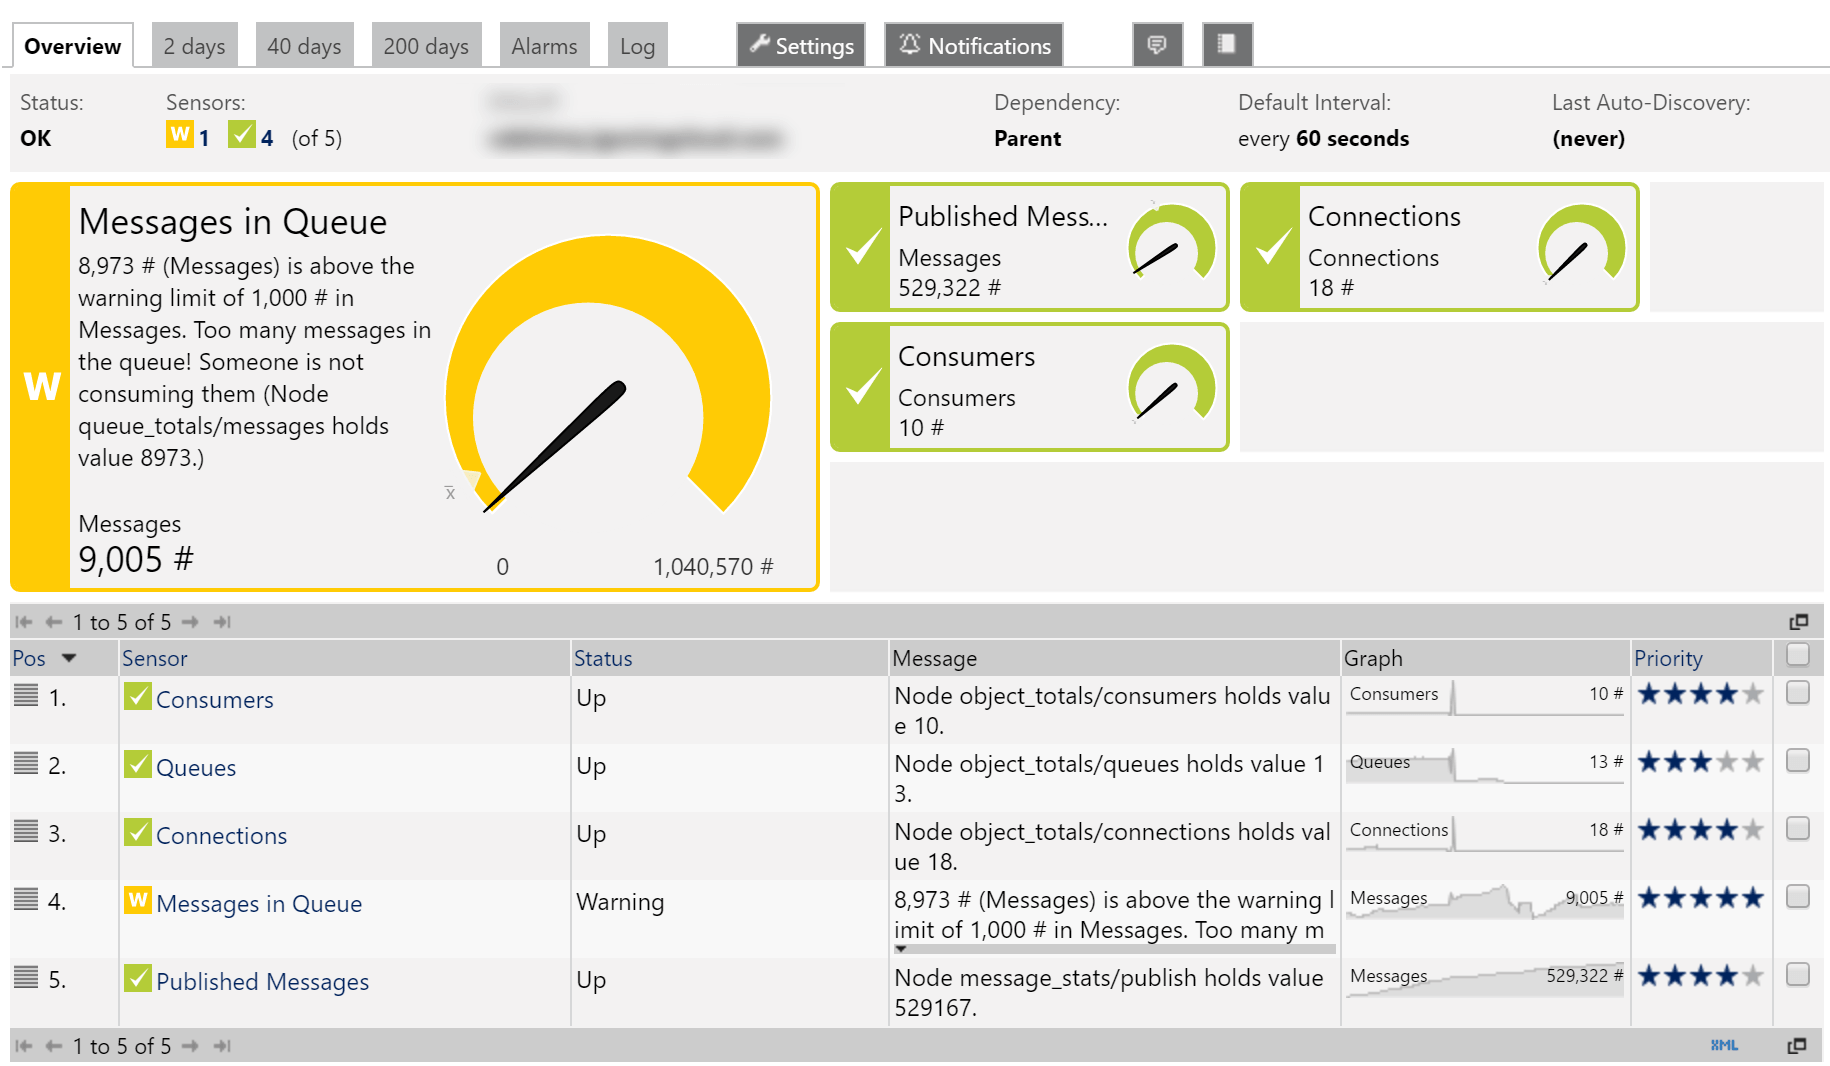
Let's say for example, you want to monitor the total amount of messages in the queue (perhaps someone is not retrieving messages from the queue and the cluster is starved of resources). In the URL we can supply the overview API endpoint http://server-name:15672/api/overview while in the XML Node (the naming here applies also to JSON) we specify queue_totals/messages since the messages property is located inside the queue_totals object in the JSON API response. For authentication we use the credentials we created earlier.
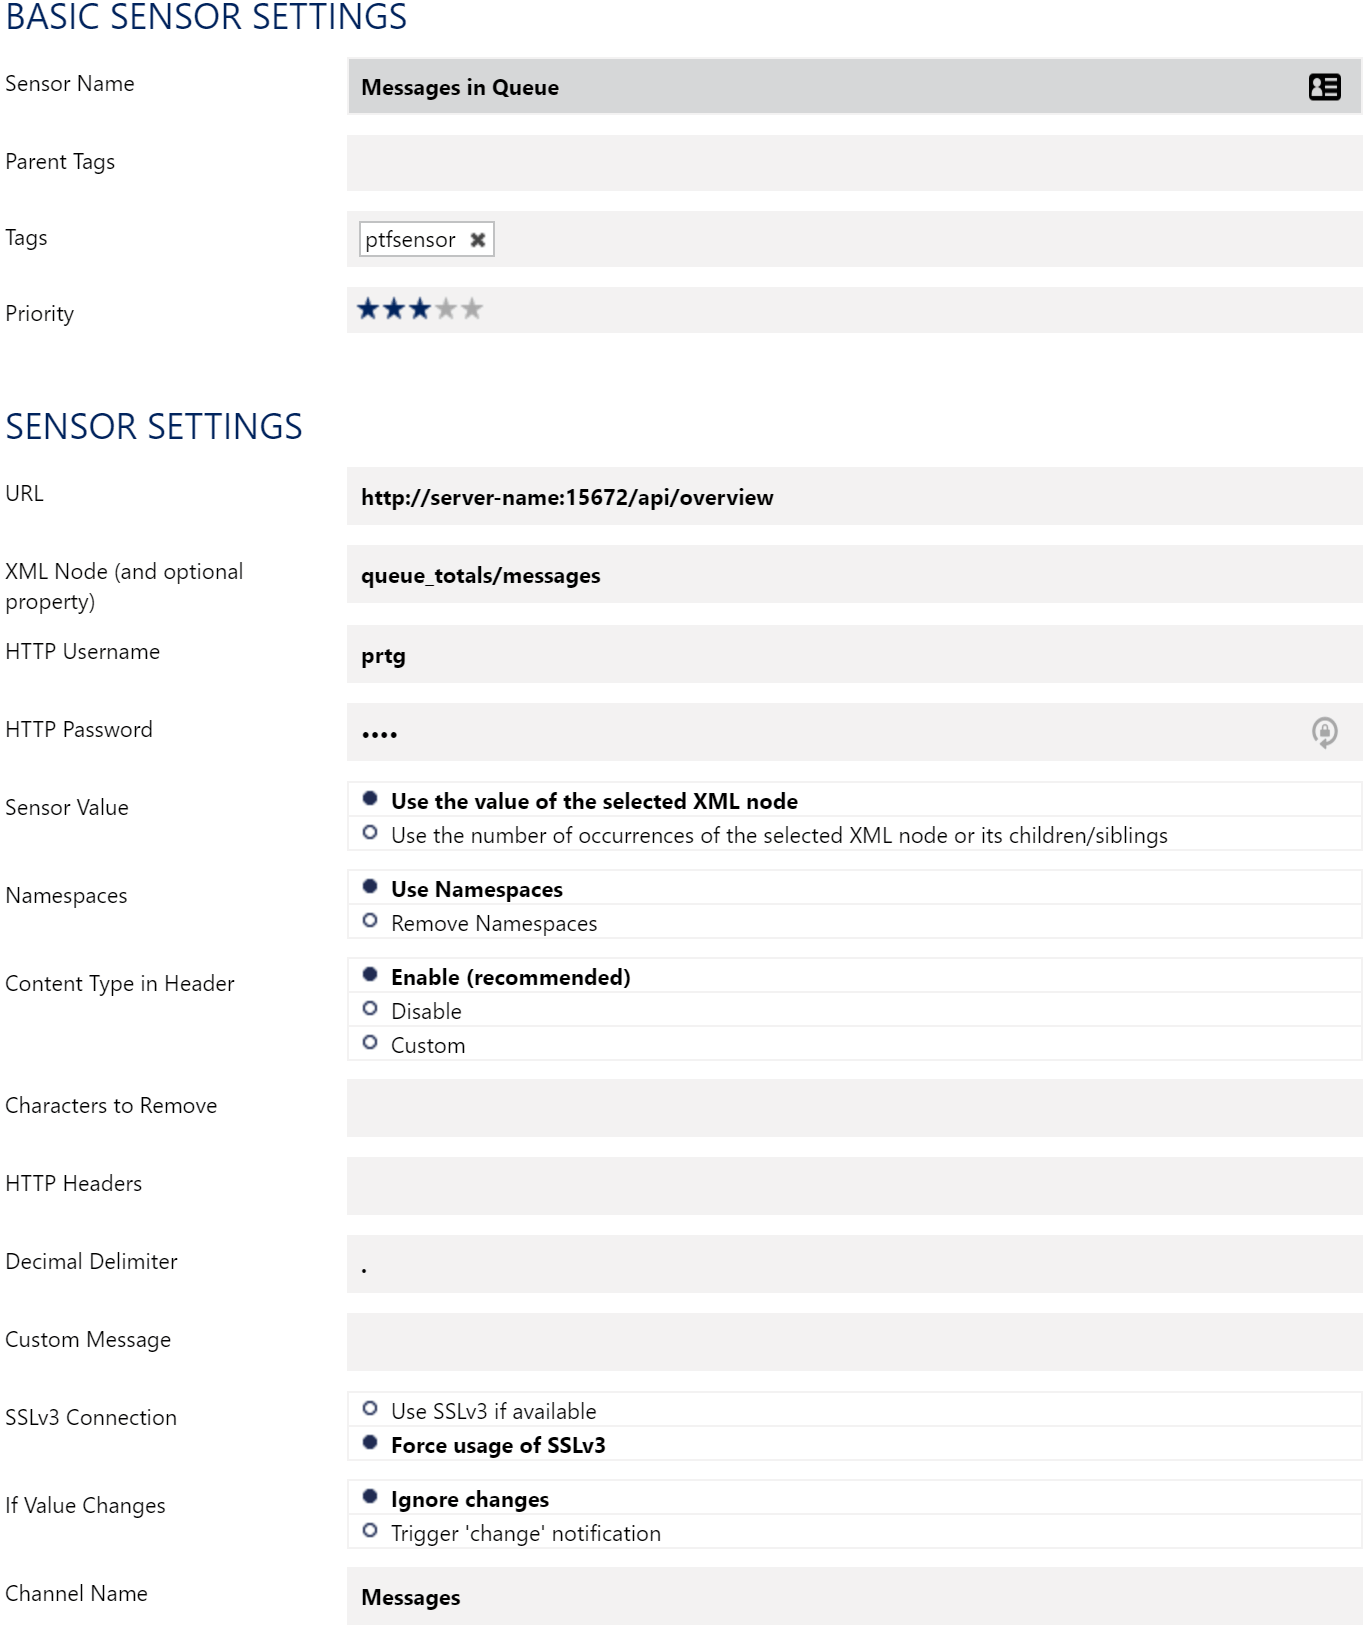
Unfortunately, it is not possible to create one sensor and read multiple values in PRTG, so for each value you want to query you have to create a separate sensor.
There is a lot you can query via the RabbitMQ API and not every sensor applies to every system. You can check the documentation at http://server-name:15672/api to see what values you can query via the API.
Apart from these, it is also a good idea to monitor the underlying infrastructure running your RabbitMQ cluster: